CINELYTIC JUNE INSIGHTS – The Audience Comes First: What 90 Horror Films Reveal About Where Box Office Really Comes From
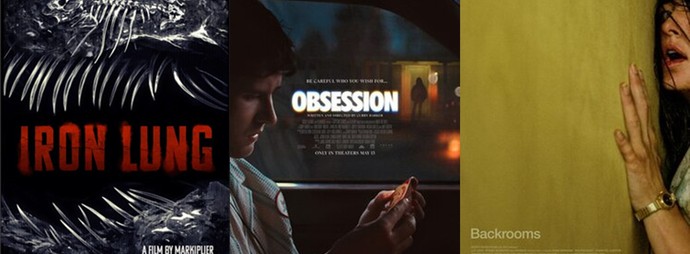
This past weekend, A24’s BACKROOMS delivered a historically strong domestic opening for the distributor. It should not have surprised anyone paying attention to the right signal, as the film arrived with an enormously pre-built audience as one of YouTube’s most recognizable horror properties.
Likewise, Focus Features’ OBSESSION comes from a filmmaker, Curry Barker, who built a substantial following on YouTube before making the jump to features. That same kind of preexisting audience helped propel a popular YouTuber’s self-distributed IRON LUNG to US$41M earlier this year on a US$3M production budget.
That is the thread running through our analysis of 90 horror films released between 2022 and 2026. Across budget tiers, distributors, IP types, and review scores, one variable explains commercial outcomes better than any other, and it’s not how much you spend. Instead, it is the size and intensity of the audience that already exists before the film is made.
In horror, it’s becoming clearer that you do not buy your way to a hit. You either inherit an audience, or you earn one through a concept so attractive that it builds its own. Production budget is the least predictive number in the genre.
The five charts that follow each approach this from a different angle — budget, distributor, IP source, and audience reception. They converge on the same conclusion.
1. Spending More Does Not Reliably Earn More
Start with the most basic question a financier asks: does a bigger production budget produce a bigger return? According to the dataset, the answer is no, as the return multiple declines as budgets rise through the middle of the market, and only recovers at the very top where established franchises live:
Chart 1: Median production budget vs. median domestic box office by budget tier, with the production-only return multiple. The multiple collapses through the mid-budget range.
Micro-budget horror (budgets under US$1M) returns a median of 10.6x production cost, the same kind of efficiency that built Blumhouse and sustains the genre’s reputation as a financier’s friend. However, the moment budgets cross into the US$1–30M range, the median return multiple collapses to between 1.3x and 1.8x. A US$22M film returns no more reliably than a US$10M one. Only at US$30M+ tier does the multiple recovers to 2.2x, and that is because that tier is dominated by franchises with guaranteed audiences, not because more money is spent.
Now for the most important caveat in the entire analysis: these figures reflect production budget only. They do not include marketing, which in this business is enormous. A wide release on 3,000-plus theaters typically carries US$20–40M or more in prints-and-advertising spend, frequently exceeding the production budget itself. A US$10M film that goes wide may carry US$25M in marketing, which means its true cost is US$35M, and its real return multiple is a fraction of what the production-only figure suggests.
One further context that matters: roughly 50% of domestic box office revenue stays with the exhibitor. Only after that deduction can the distributor recover its fees and marketing expenses discussed above. What ultimately flows back to financiers and filmmakers is the net of all those deductions. A $37M median domestic gross for a wide release is a very different number once the full cost stack is applied
The ROI advantage of micro-budget films that get distribution is real, but it’s also somewhat influenced by the fact that they typically receive far less marketing support. Wide-release films spend heavily to reach national audiences, and those marketing costs are not reflected in the production budget figures used in most ROI comparisons.
What matters is the relationship between total cost, production plus marketing, and the audience that can be reliably converted to ticket sales. And the best predictor of that audience is not budget at all. It is what comes next.
2. The Pre-Existing Audience Is the Asset
The industry often lumps all IP-based horror into a single category, but that overlooks the most important factor: the audience that comes with it. A video game with millions of active fans is a very different starting point than a public domain character or a moderately successful novel. Breaking IP out by source makes it much easier to see the impact that built-in audiences can have on a film’s performance:
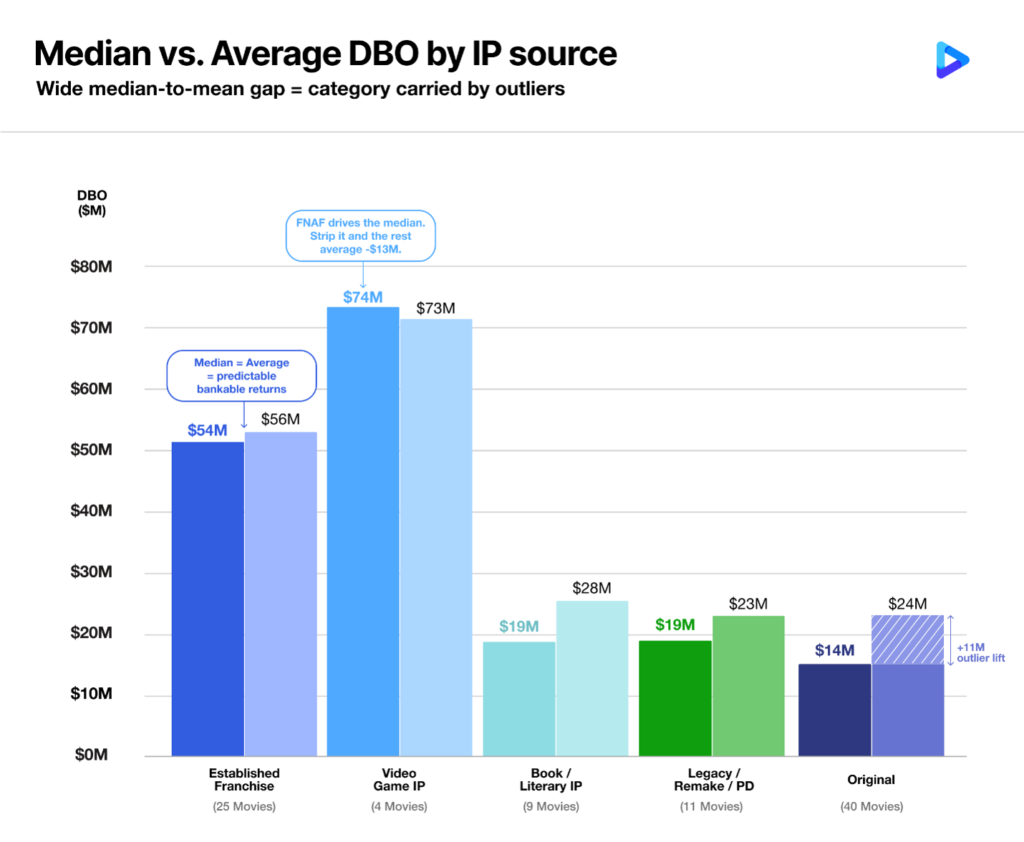
Chart 2: Median (solid) vs. Average (faded) DBO by IP source type and Original. A tight median-to-average gap means consistent performance; a wide gap means the category is carried by outliers.
Established horror franchises generate a median domestic gross of US$54M and an average of US$56M, virtually identical results. That consistency reflects the strength of their built-in audiences. Franchises like SCREAM, THE CONJURING, and FINAL DESTINATION tend to deliver reliable performance year after year, with no single breakout hit skewing the numbers. Video Game IP sits at a US$74M median, the highest of any category, which is made up of four. FIVE NIGHTS AT FREDDY’S (US$137M) and its sequel FIVE NIGHTS AT FREDDY’S 2 (US$128M) are doing most of the work. UNTIL DAWN (US$20M) and RETURN TO SILENT HILL (US$6M) sit far below. Remove the FNAF films and the rest average around US$13M.
The lesson is not that video game IP is reliably valuable. It is that video game IP with an active, theater going fanbase is. FIVE NIGHTS AT FREDDY’S arrived with millions of players and further benefited from years of massive social media and YouTube popularity surrounding the game. RETURN TO SILENT HILL did not. FIVE NIGHTS AT FREDDY’S did not succeed because it was based on a game. It succeeded because the audience already existed, already cared, and was already waiting. That is the asset. The IP is just the container.
Book and literary IP (US$19M median, US$28M average) and legacy or public domain IP (US$19M median, US$23M average) tell a similar story. Each category is carried by a single dominant outlier, with THE BLACK PHONE at US$90M for books and NOSFERATU at US$96M for legacy IP, sitting above a long tail of more modest performers. A Stephen King adaptation is not the same asset as an obscure novel. A prestige NOSFERATU is not the same as a public domain cash in. The label may be the same, but the built in audience is not. .
Original horror sits at a US$14M median against a US$24M average, the widest proportional gap of any category and the clearest example of why averages can be misleading. SMILE, M3GAN, BARBARIAN, and TALK TO ME pull the average up significantly, but the typical original horror film lands well below US$24M. Originals offer the highest upside, but also the most risk. When a concept is strong enough to build its own audience, the rewards can be substantial. Most, however, do not reach that level, and the median reflects that reality.
IRON LUNG, the only true creator driven film in the dataset from YouTube creator Markiplier, generated US$41M on a US$3M budget. One film is not enough to define a category, but it may represent an early proof point for something the industry is only beginning to see: the translation of major YouTube audiences into theatrical ticket buyers. The filmmakers behind BACKROOMS and OBSESSION are now succeeding in doing the same on a larger scale, bringing audiences they first built online directly into theaters.
3. The Best Distributors Match the Release to the Audience
If budget is not the primary driver of returns and audience is, then a distributor’s job is not simply to maximize theater count. It is to accurately match the size of a release to the size of the audience that already exists. The distributors that consistently get this right stand out clearly in the data:
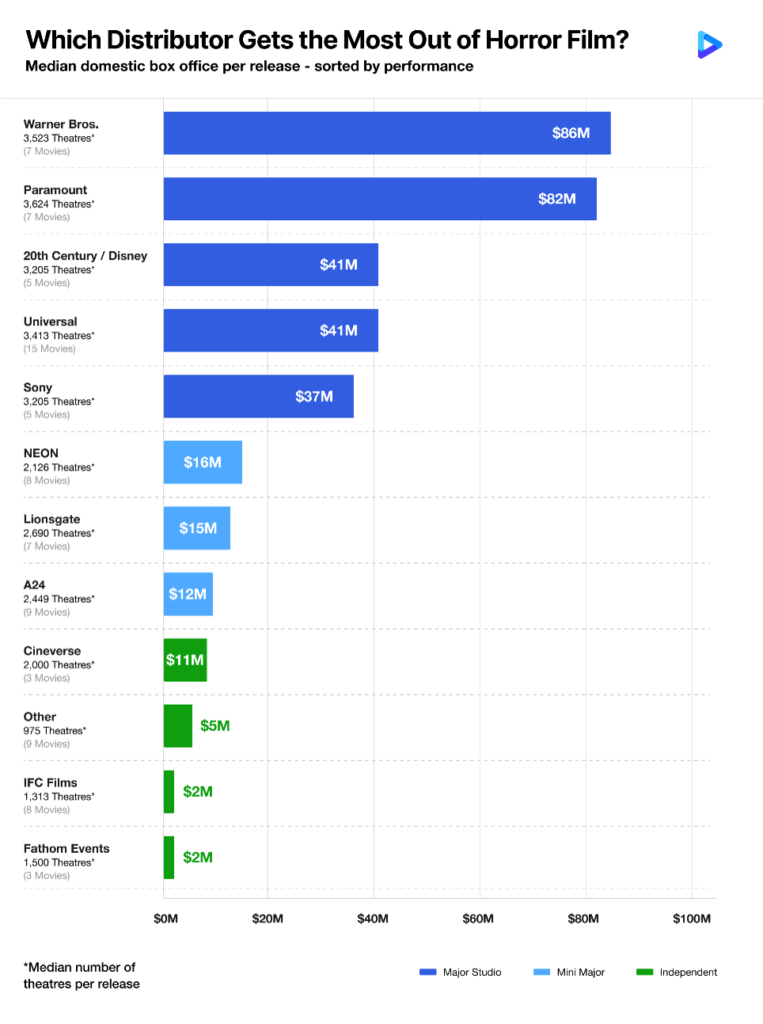
Chart 3: Median DBO (solid bar). Color = Studio tier.
Warner Bros. and Paramount lead on median DBO — $86M and $82M — but both are franchise-driven, releasing pre-sold audiences into wide distribution. Paramount’s average ($74M) actually sits below its median ($82M), the signature of a consistent, low-variance slate where no single film distorts the picture. That predictability is itself valuable.
Universal is the genre’s highest-volume player at 15 films, but its $37M median sits well below its $57M average — the widest gap of any major studio. The FNAF films pull the average up; a string of wide-release disappointments where the audience did not match the theater count (WOLF MAN, ABIGAIL, HIM) pull the median down. NEON, by contrast, deploys a fraction of the capital — $8M median budget, 2,126 median theaters — and extracts a competitive $16M median, with LONGLEGS ($74M) showing what its model produces when a concept connects.
A sharper efficiency test is to set aside production budget entirely — since marketing costs are unavailable — and instead ask how hard each theater worked. Per-theater revenue is the most marketing-neutral measure available: it reflects whether the audience showed up relative to the theaters opened, regardless of what was spent putting them there.
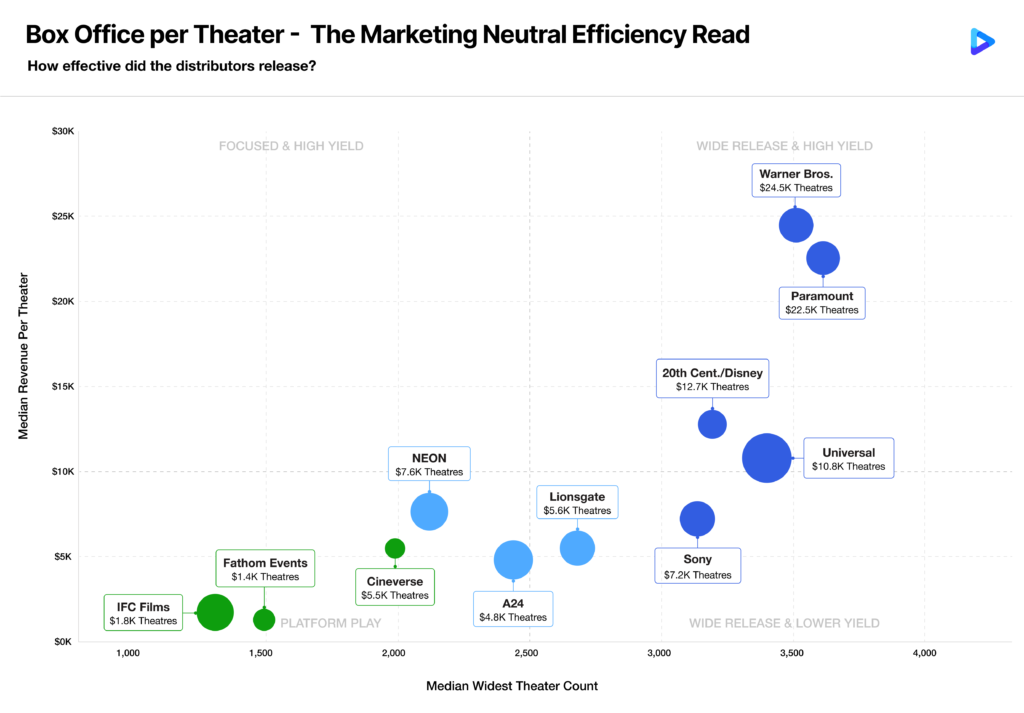
Chart 4: Median theater count vs. median per-theater revenue by distributor. Dot size = number of films. The most marketing-neutral efficiency metric available.
The quadrant structure tells the story cleanly. Warner Bros. and Paramount sit top-right — wide release and high yield — because franchise audiences arrive pre-sold and every theater they open fills reliably. Universal sits wide but lower at $10.8K per theater, reflecting the gap between its FNAF-driven peaks and the wide-release titles that did not match their theater count.
The most instructive comparison is Sony and NEON. Sony opens on a median 3,147 theaters and earns $7.2K per theater. NEON opens on 2,126 theaters and earns $7.6K per theater. Near-identical per-theater efficiency — but Sony commits to roughly 1,000 more theaters per release, carrying a proportionally heavier marketing load to sustain them. NEON’s model extracts the same audience yield at materially lower distribution cost. That is the efficiency gap that production-budget ROI charts cannot show. Per-theater revenue does not lie about marketing spend, because it does not require marketing data. It simply asks: for every theater you opened in, how much did the audience pay to sit in it? The answer says more about audience matching than any budget multiple.
4. The Audience Tells You Before the Critics Do
If audience is the real asset, then the most valuable signal a studio can track is what moviegoers think, not what critics think. The relationship with box office performance is clear, and the data leaves little doubt about which one matters more:
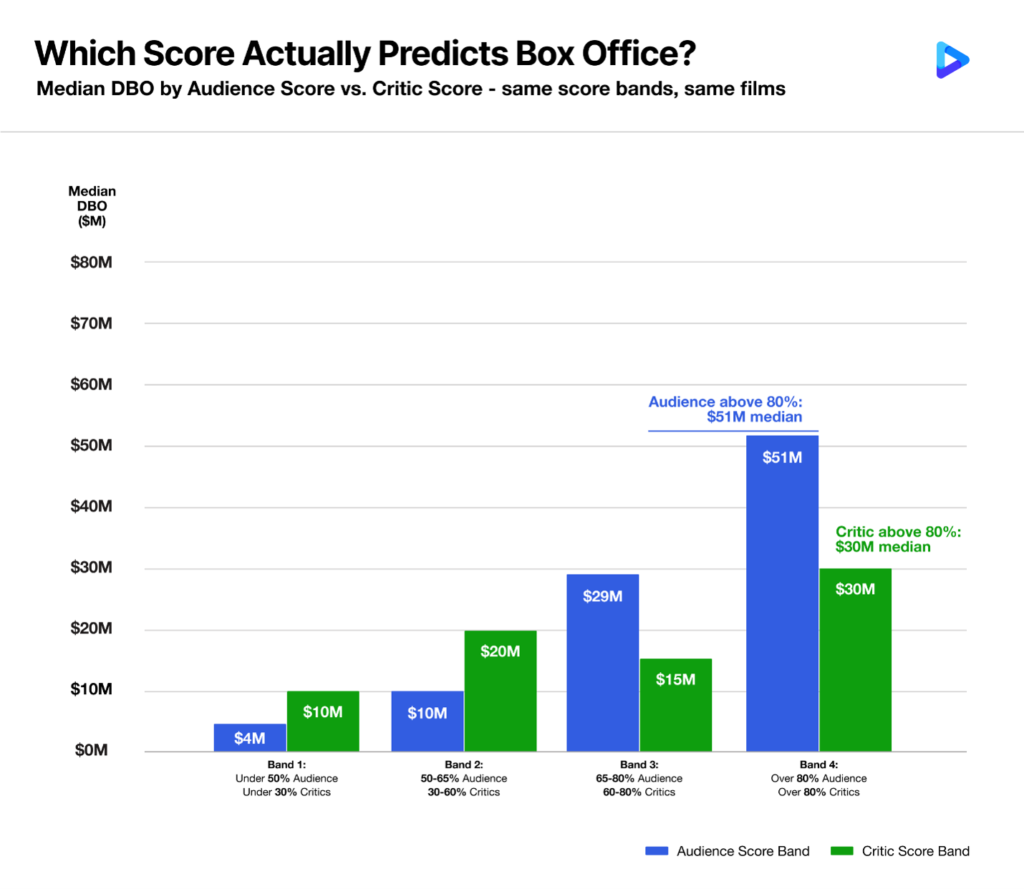
Chart 5: Median DBO by Rotten Tomatoes audience score band (blue) vs. Rotten Tomatoes critic score band (green), using identical ranges. Audience score steps up consistently; critic score does not.
The relationship between audience scores and box office is remarkably consistent. Films below 50% generate a US$4M median domestic gross, compared to US$10M for 50% to 65%, US$29M for 65% to 80%, and US$51M above 80%. As audience scores rise, box office rises with them.
Critic scores show no such pattern. In fact, films in the 60% to 80% critic range underperform those in the 30% to 60% range, suggesting little meaningful relationship between critical reception and horror box office.
The examples are telling. FIVE NIGHTS AT FREDDY’S earned 33% from critics and generated US$137M. THE EXORCIST: BELIEVER earned 22% and reached US$66M. Of course, there are exceptions: LONGLEGS earned 85% from critics and reached US$74M despite a 61% audience score. However, across the dataset, audience sentiment remains a much stronger predictor of horror box office than critic scores.
The advantage for studios is straightforward: audience sentiment can be measured early through test screenings and trailer reactions with tools such as SocialSense360. That provides an opportunity to gauge demand and adjust release plans before committing to the costs of a wide theatrical launch.
The Through-Line: Find the Audience First
The presented data points to the same conclusion throughout. Budget alone does not drive returns. IP only matters when it brings a real audience with it. The most successful distributors match release size to actual demand, not projected demand. And when it comes to measuring that demand, audience sentiment consistently proves more useful than critical reception.
The biggest disappointments in the dataset share a common trait: they were released as if a large audience existed when it did not. Films like THE WATCHERS, WOLF MAN and AFRAID carried wide releases and significant marketing support but lacked the audience to justify that scale. By contrast, films like FIVE NIGHTS AT FREDDY’S, IRON LUNG, OBSESSION, and BACKROOMS arrived with audiences already in place.
The difference between a successful horror release and an expensive miss is often decided long before opening weekend. It comes down to accurately identifying the audience that exists and sizing the investment accordingly. The distributors winning most consistently in horror are not necessarily spending more. They are simply reading the audience earlier and acting on that information more effectively.
Cinelytic models revenue across 80 international territories from the development stage, with 88%+ title-level accuracy. SocialSense360 delivers structured audience sentiment reports at 24h, 48h, 7-day, and 14-day intervals following trailer and campaign releases — the early audience signal this analysis identifies as the genre’s most predictive variable. To learn more, visit thecinelyticgroup.com.


